Flaky Test Management
By enabling test retries, the Cypress Dashboard can detect, flag, and track flaky tests from your recorded Cypress test runs in your CI/CD pipeline.
info
A test is considered to be flaky when it can pass and fail across multiple retry attempts without any code changes.
For example, a test is executed and fails, then the test is executed again, without any change to the code, but this time it passes.
info
Cypress has the ability to automatically retry failed tests to mitigate flaky tests from failing entire test runs or CI builds.
Test retries is disabled by default, and you can enable it within the Cypress configuration.
Flake Detection
tip
Test flake detection is available to users with a Team Dashboard plan.
One way to battle flaky tests is to detect and monitor them as they occur in an organized and methodical manner such that you can assess their severity to assist with prioritizing their fix.
caution
Test retries is the fundamental mechanism that enables the detection of flaky tests by the Cypress Dashboard. Therefore, enabling test retries is required to take advantage of any flaky test management feature provided by the Cypress Dashboard.
Flagging Flaky Tests
Test runs with flaky tests will be flagged with the number of flaky of tests within the Dashboard "Latest runs" page. Flaky tests runs can also be filtered in and out via the "Flaky" filter within this page.
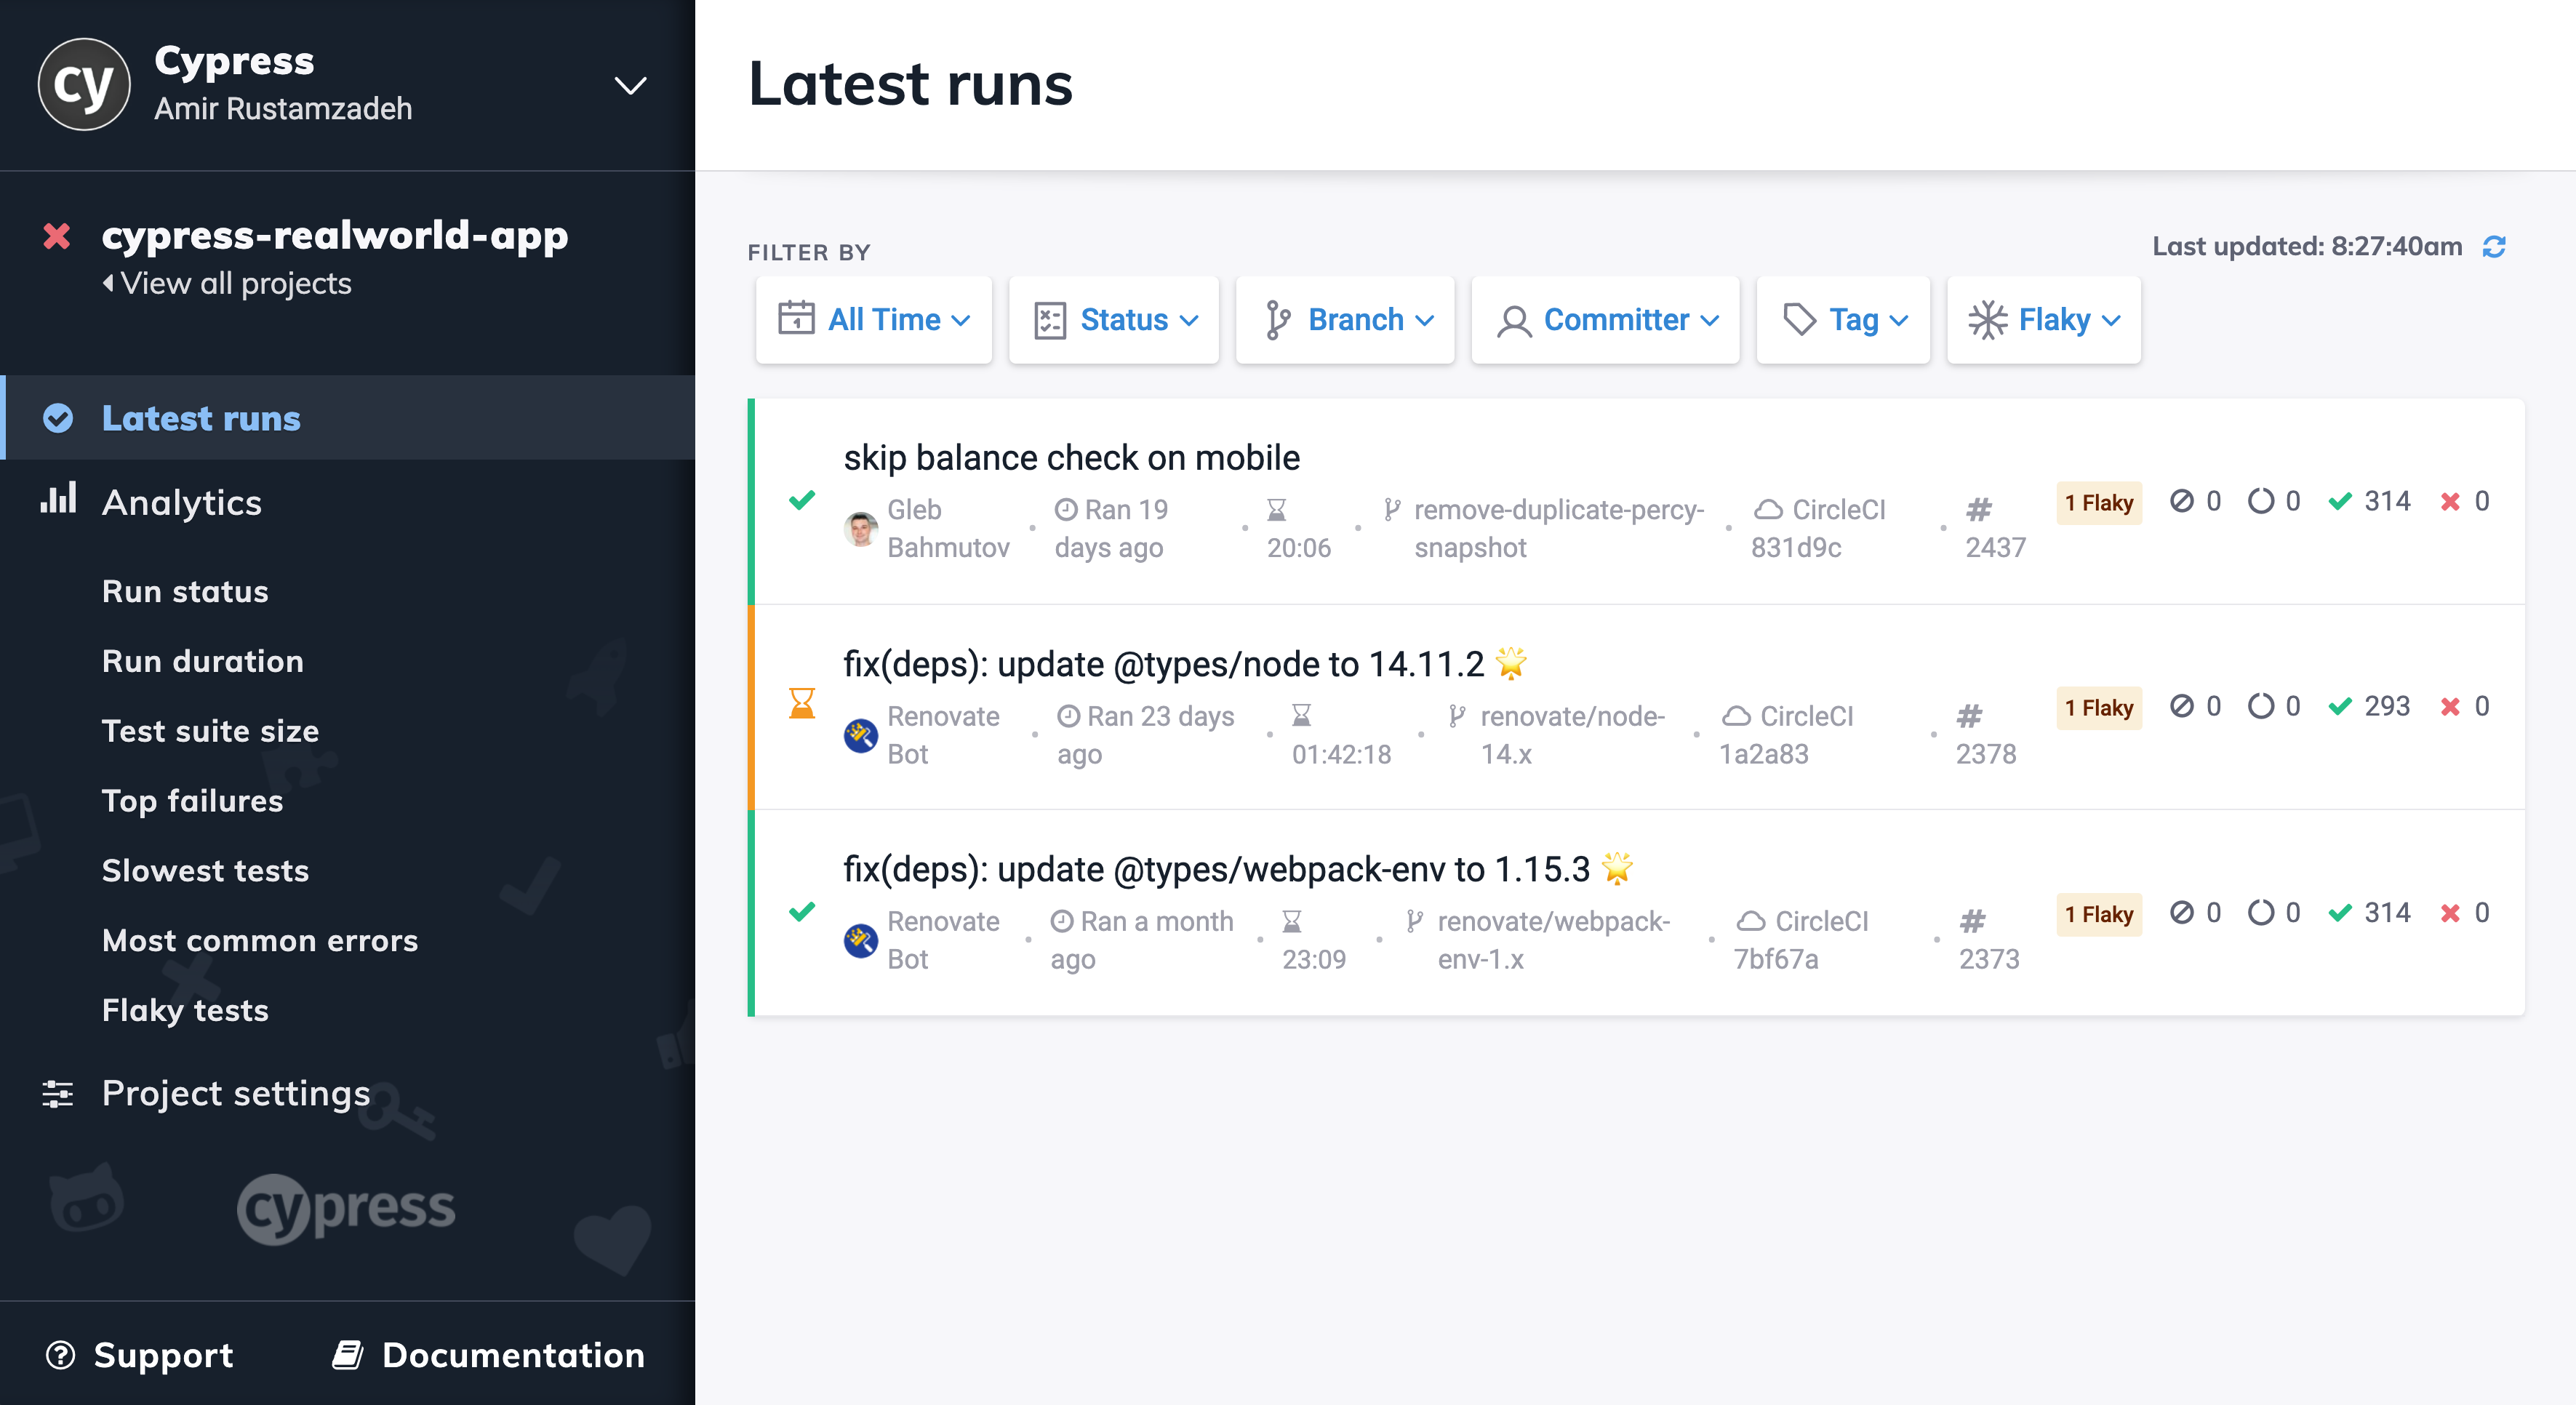
Any failure across multiple test run attempts triggered by test retrying will result in a given test case to be flagged as flaky.
Flaky Test Analytics
tip
Test flake analytics are available to users with a Team Dashboard plan.
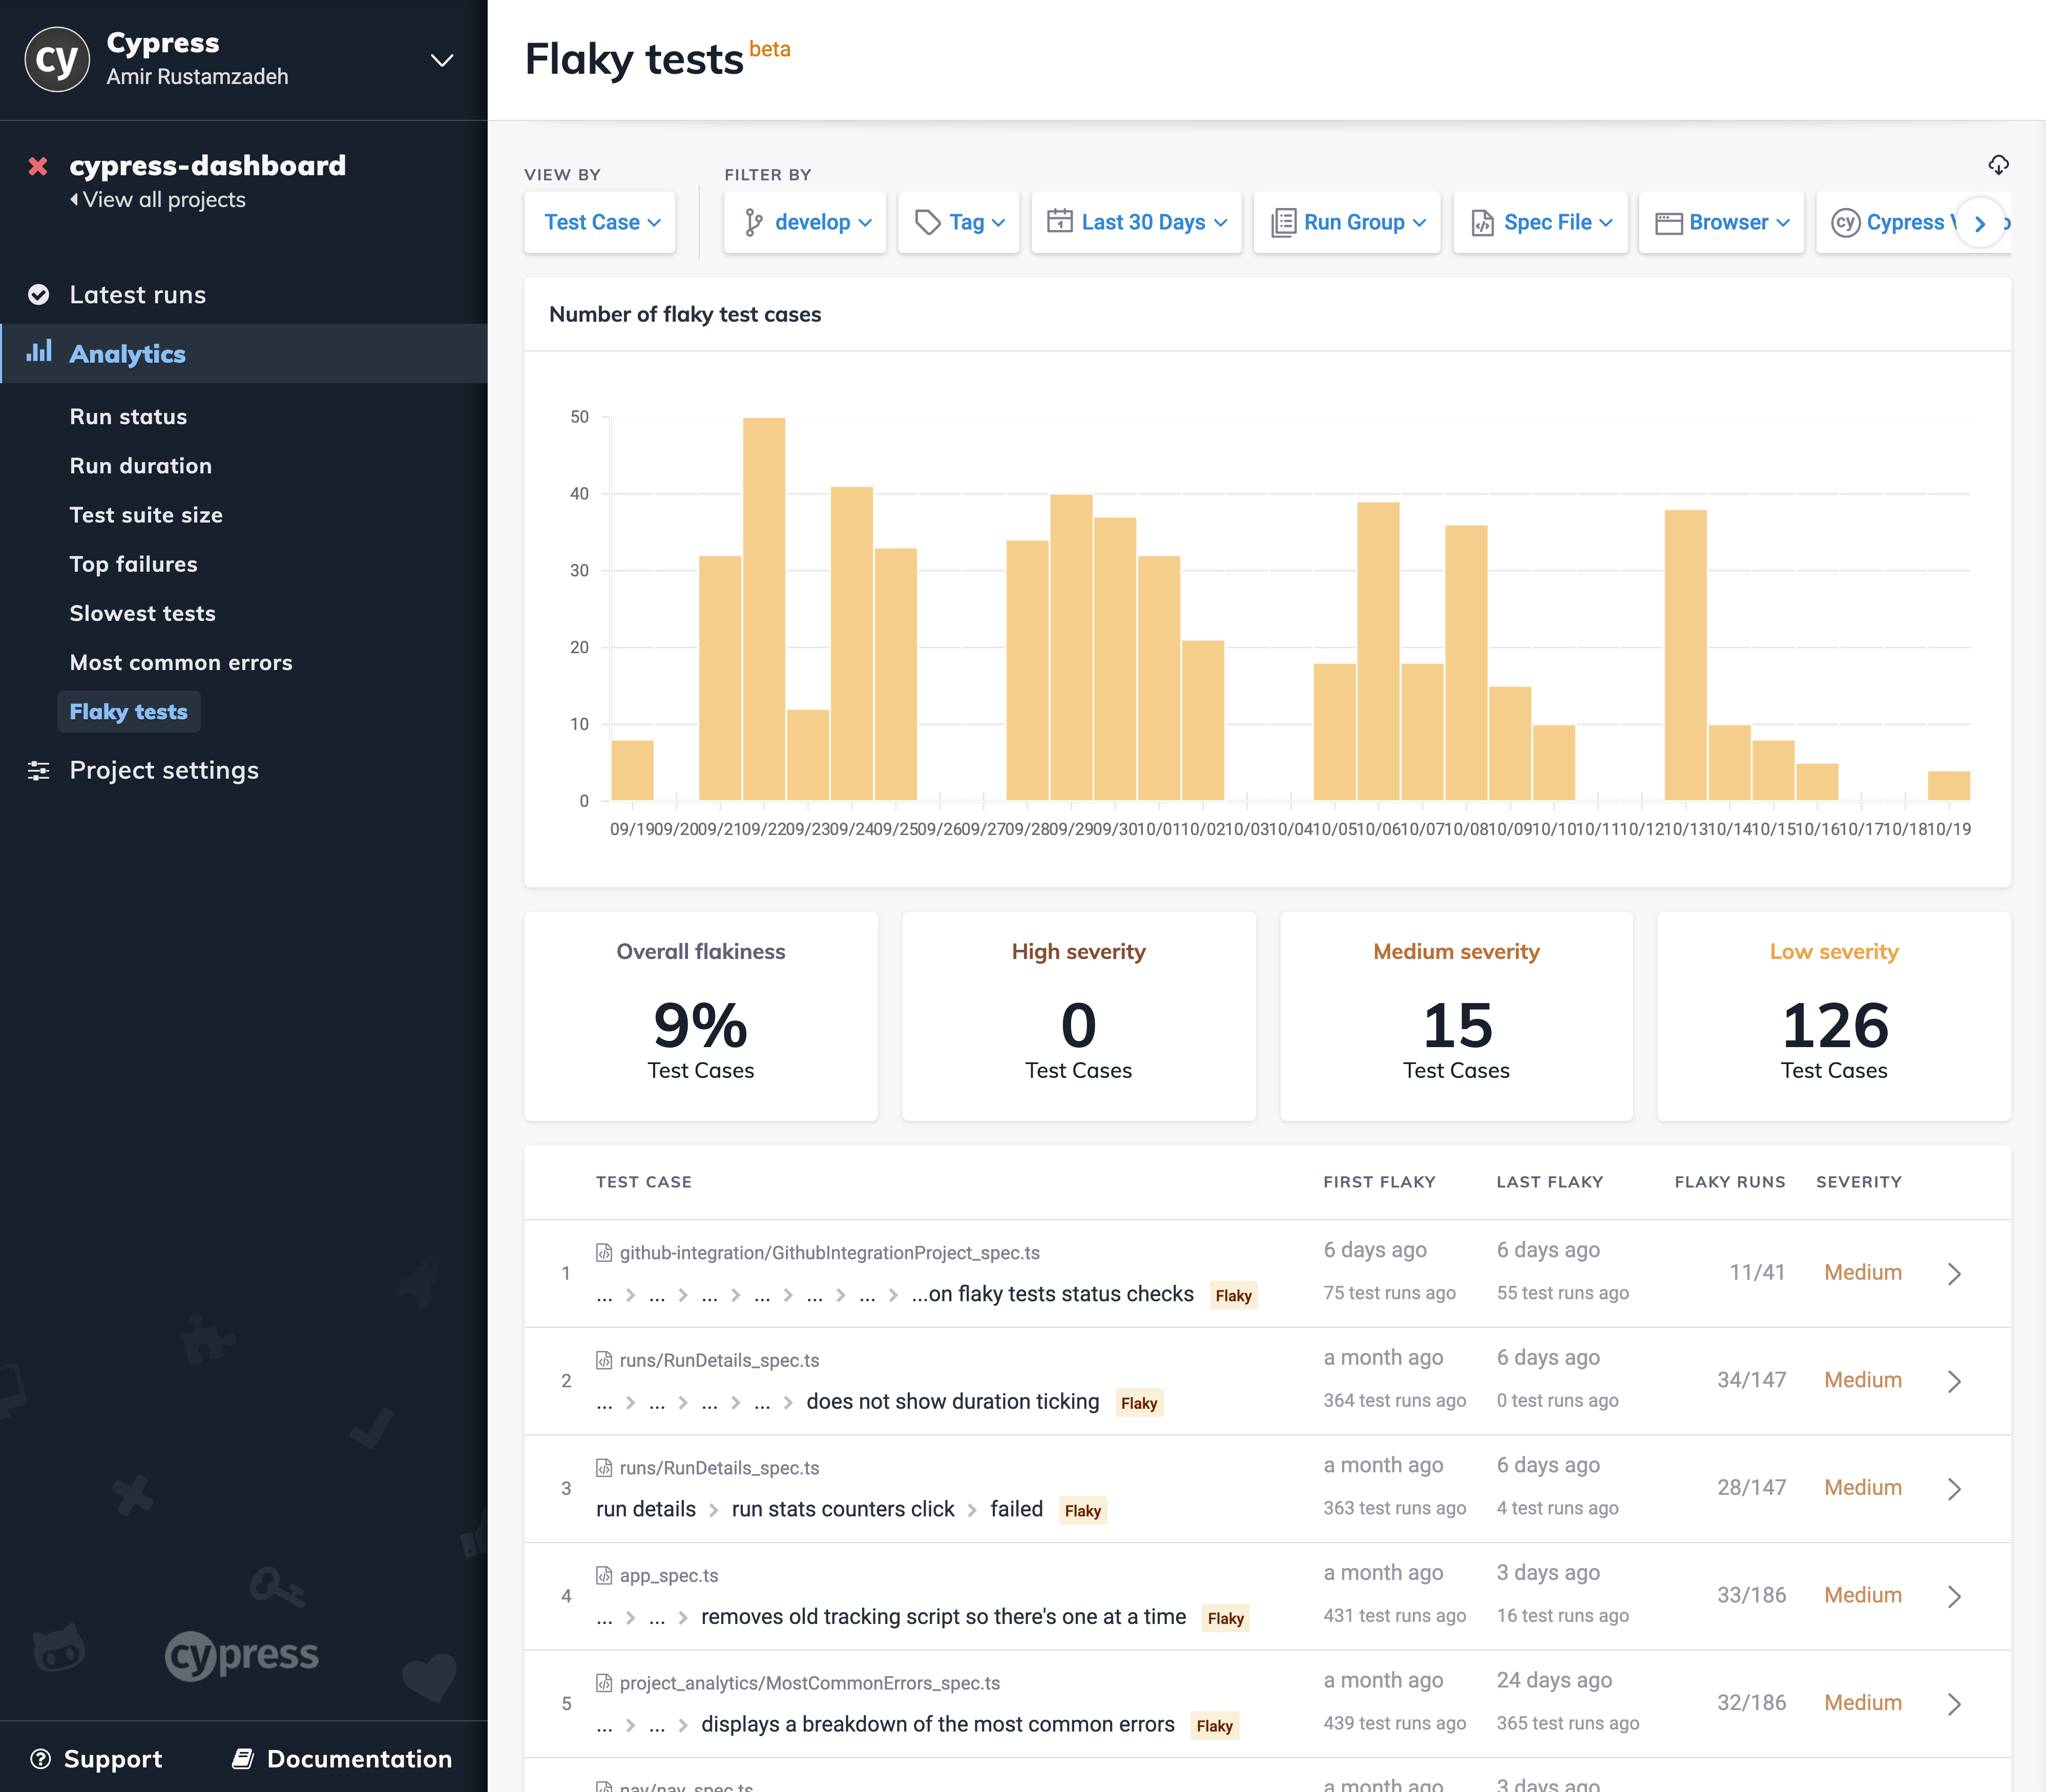
The flaky tests analytics page provides a birds-eye-view on the state of flake within your project by showing:
- Plot of the number of flaky tests over time.
- Overall flakiness level of the entire project.
- Number of flake tests grouped by their severity.
- Filterable log of all flaky test cases ordered by severity.
info
Test flake severity is determined by the frequency of flake or the flake rate of a given test. Flake severity level can be used to prioritize the work needed to resolve flake issues.
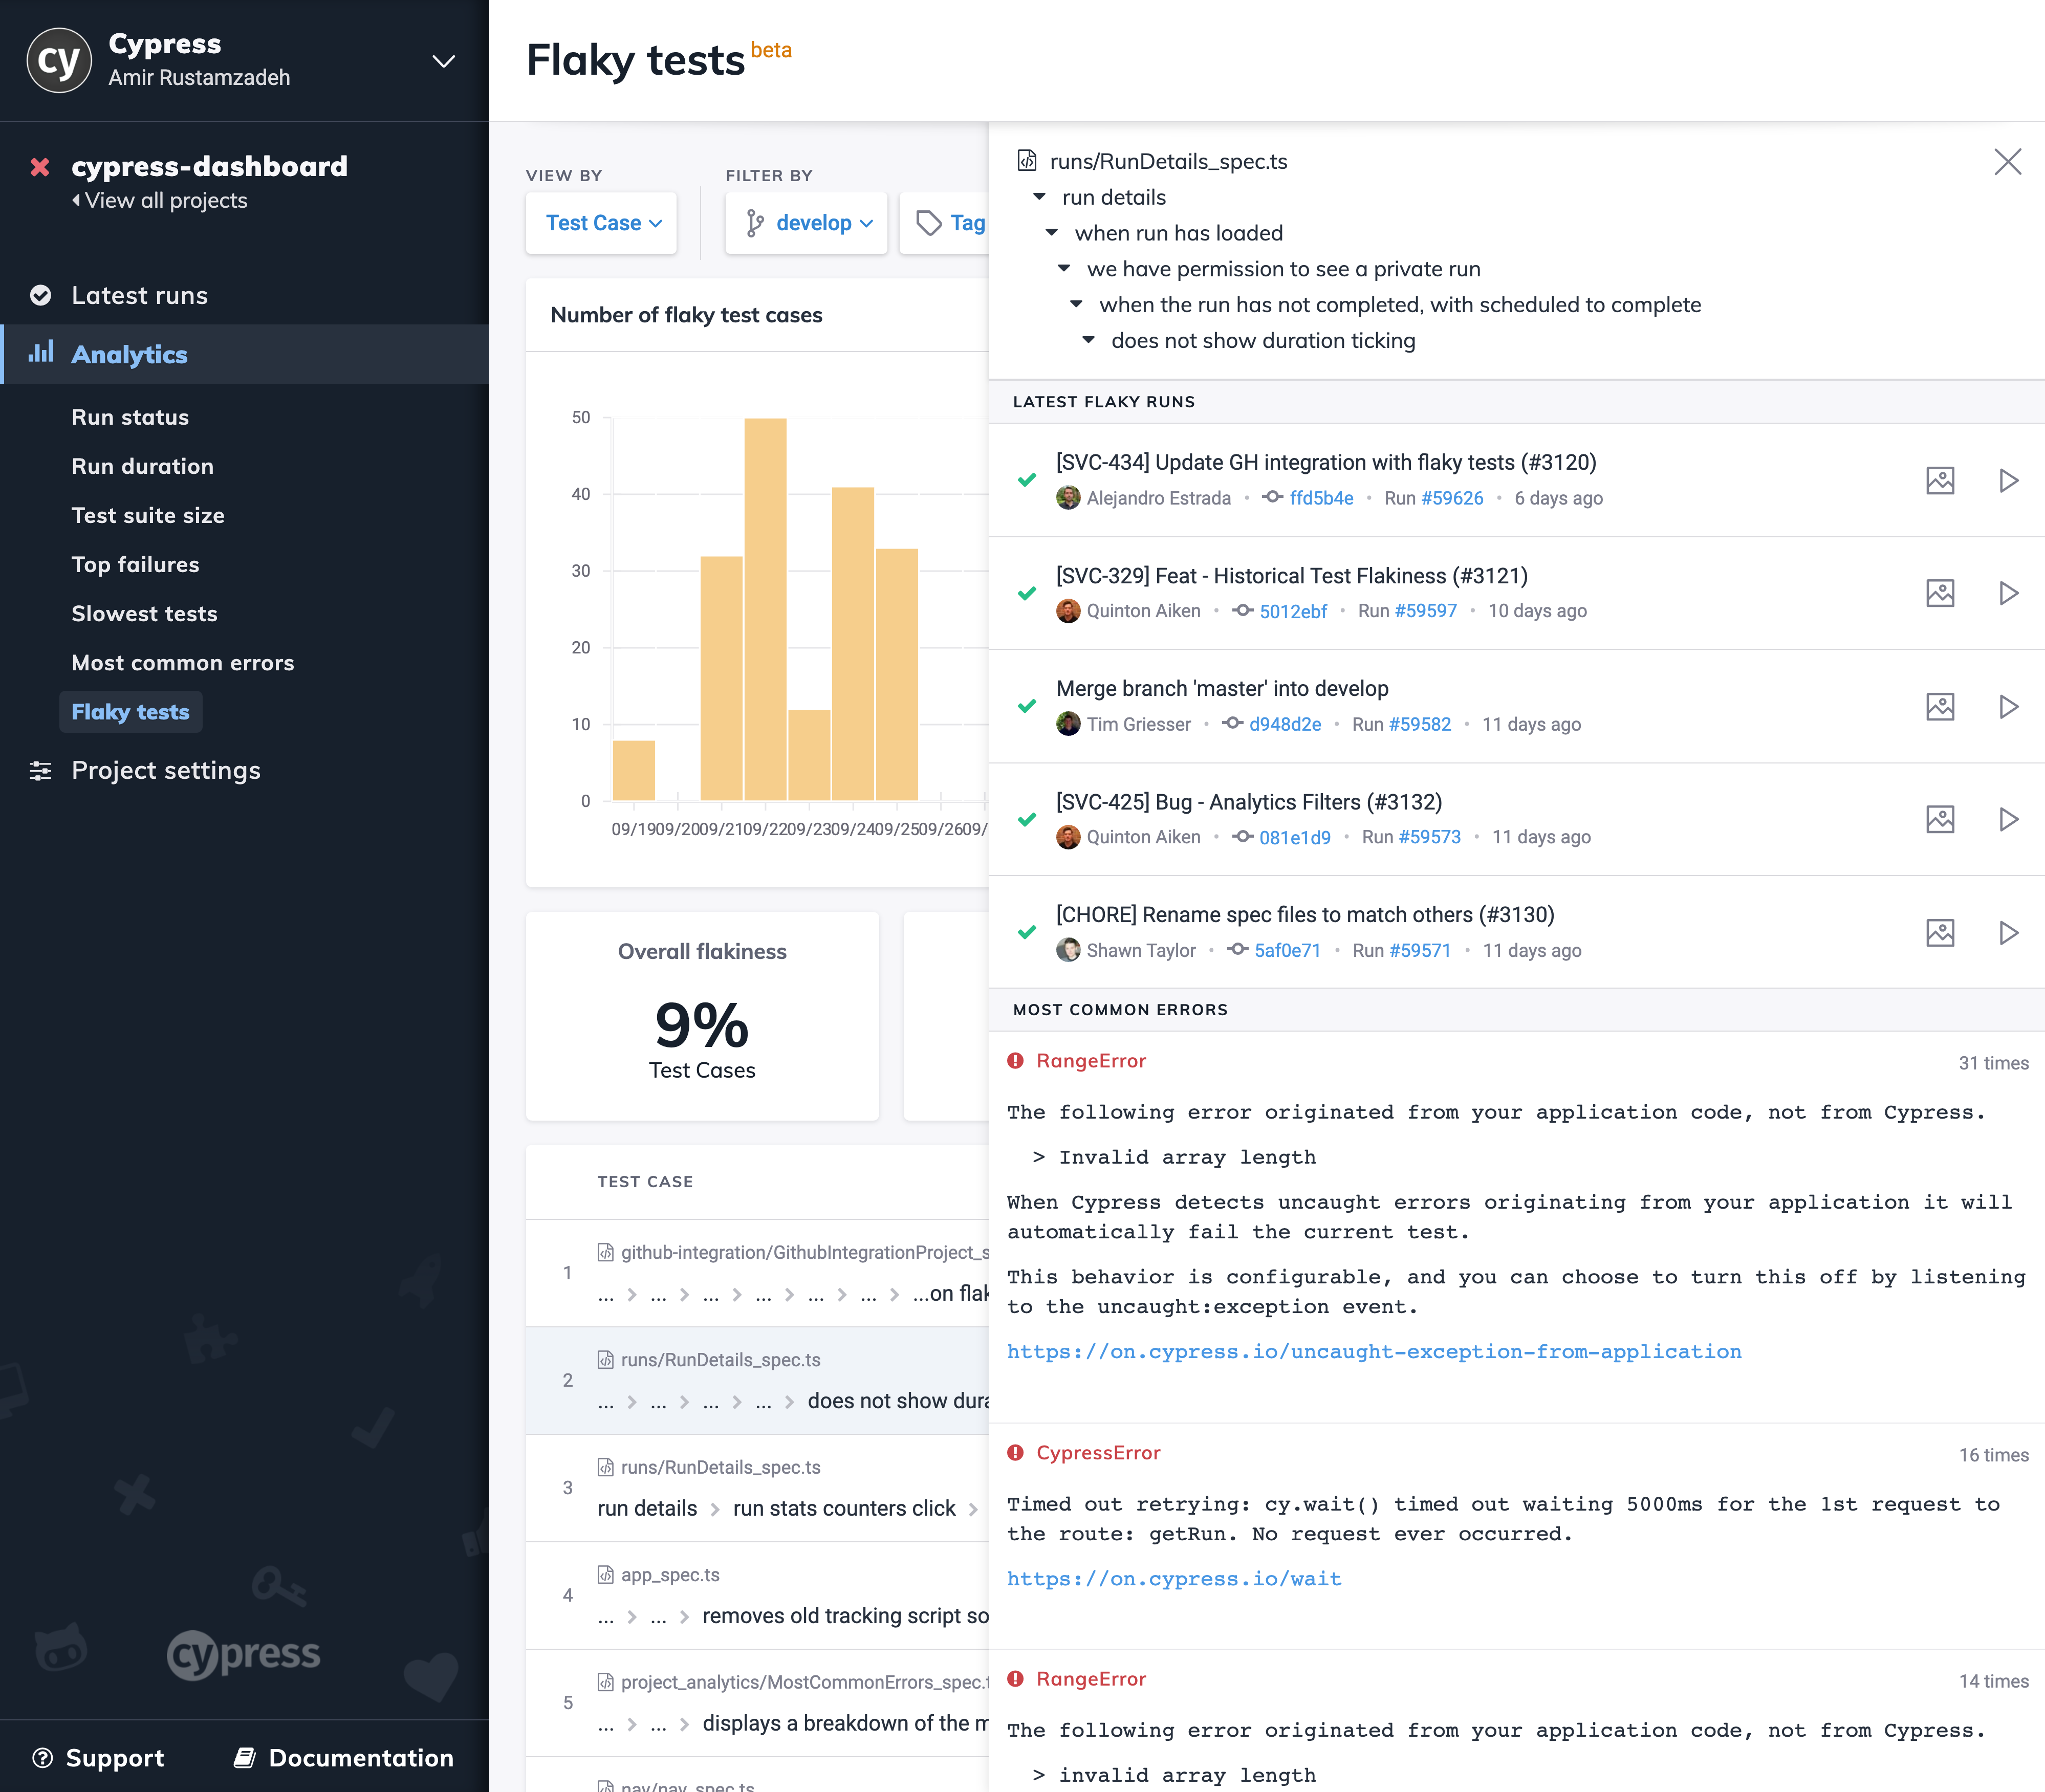
Selecting any of the flaky test cases in the analytics page will reveal a test case details panel that shows:
- Historical log of latest flaky runs
- Most common errors across the runs of the test case
- Related test case changelog
- Plot of failure rate and flaky rate over time.
All these test case level details provide deeper context around the occurrences of flake over time to assist with debugging the root cause.
Failure Rate vs Flake Rate
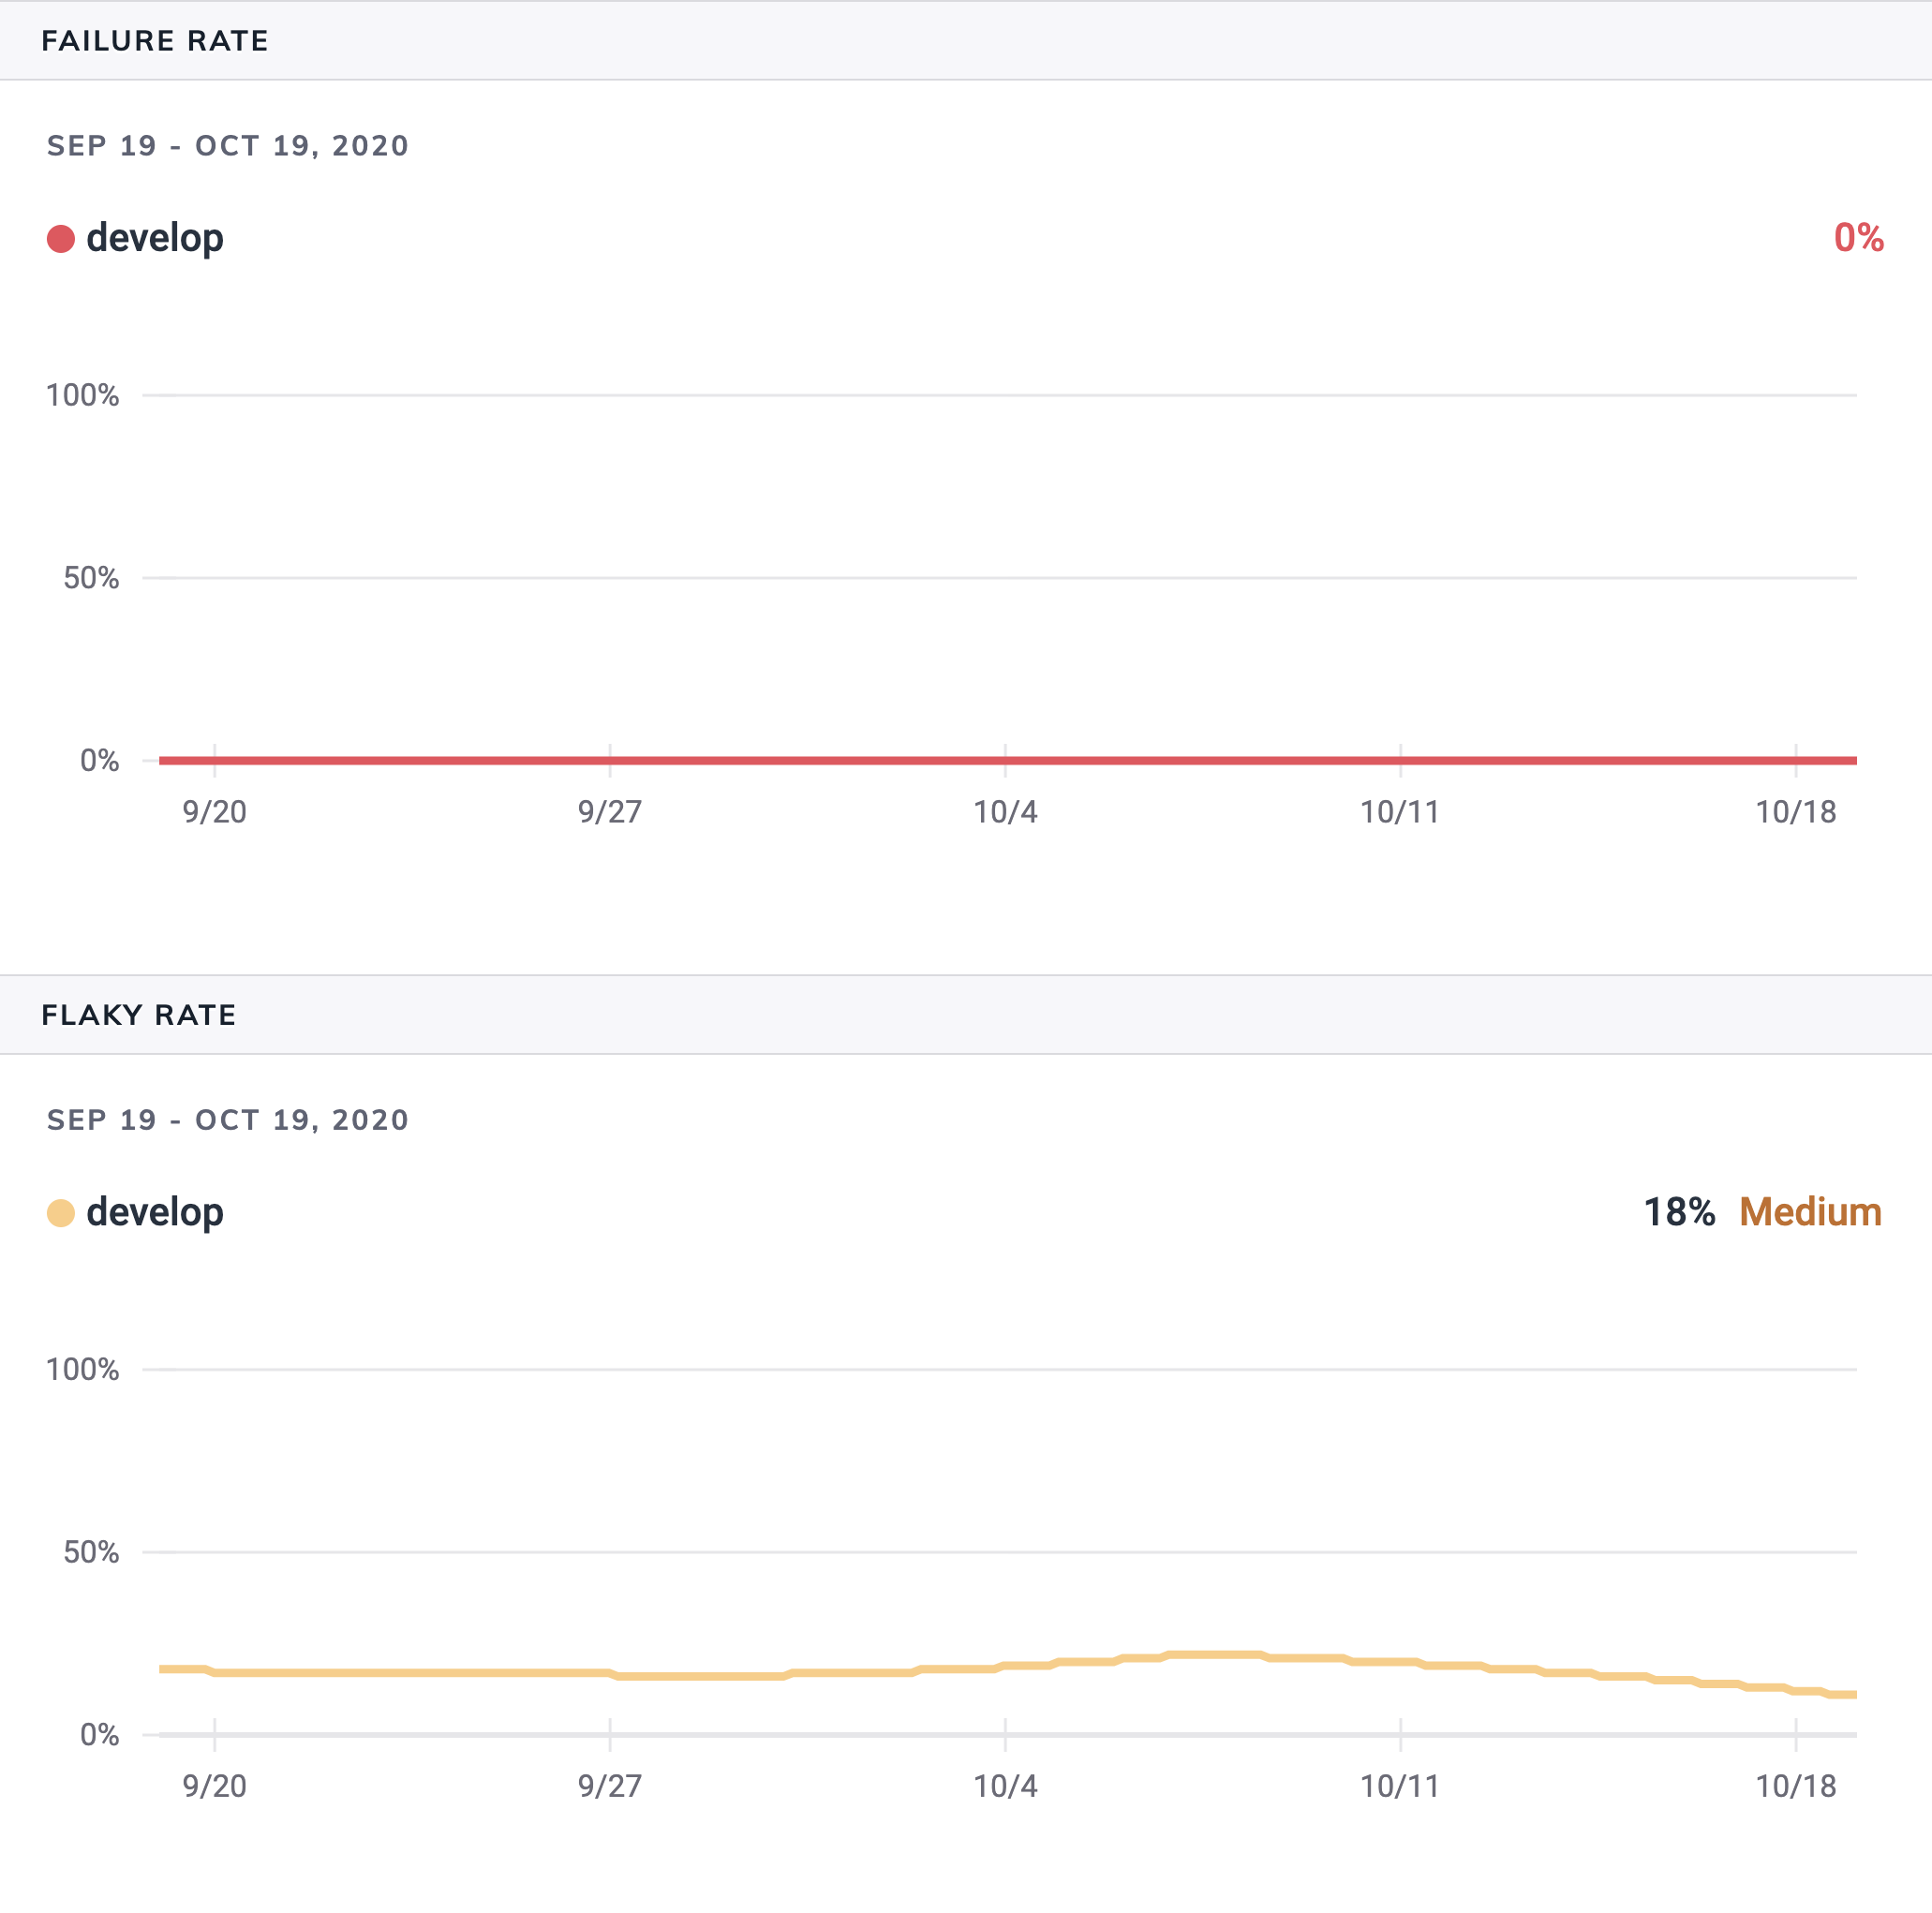
It is important to understand the distinction between failure rate and flake rate when test retries is enabled. These two metrics are tracked over time for each flaky test case within the flaky tests analytics page:
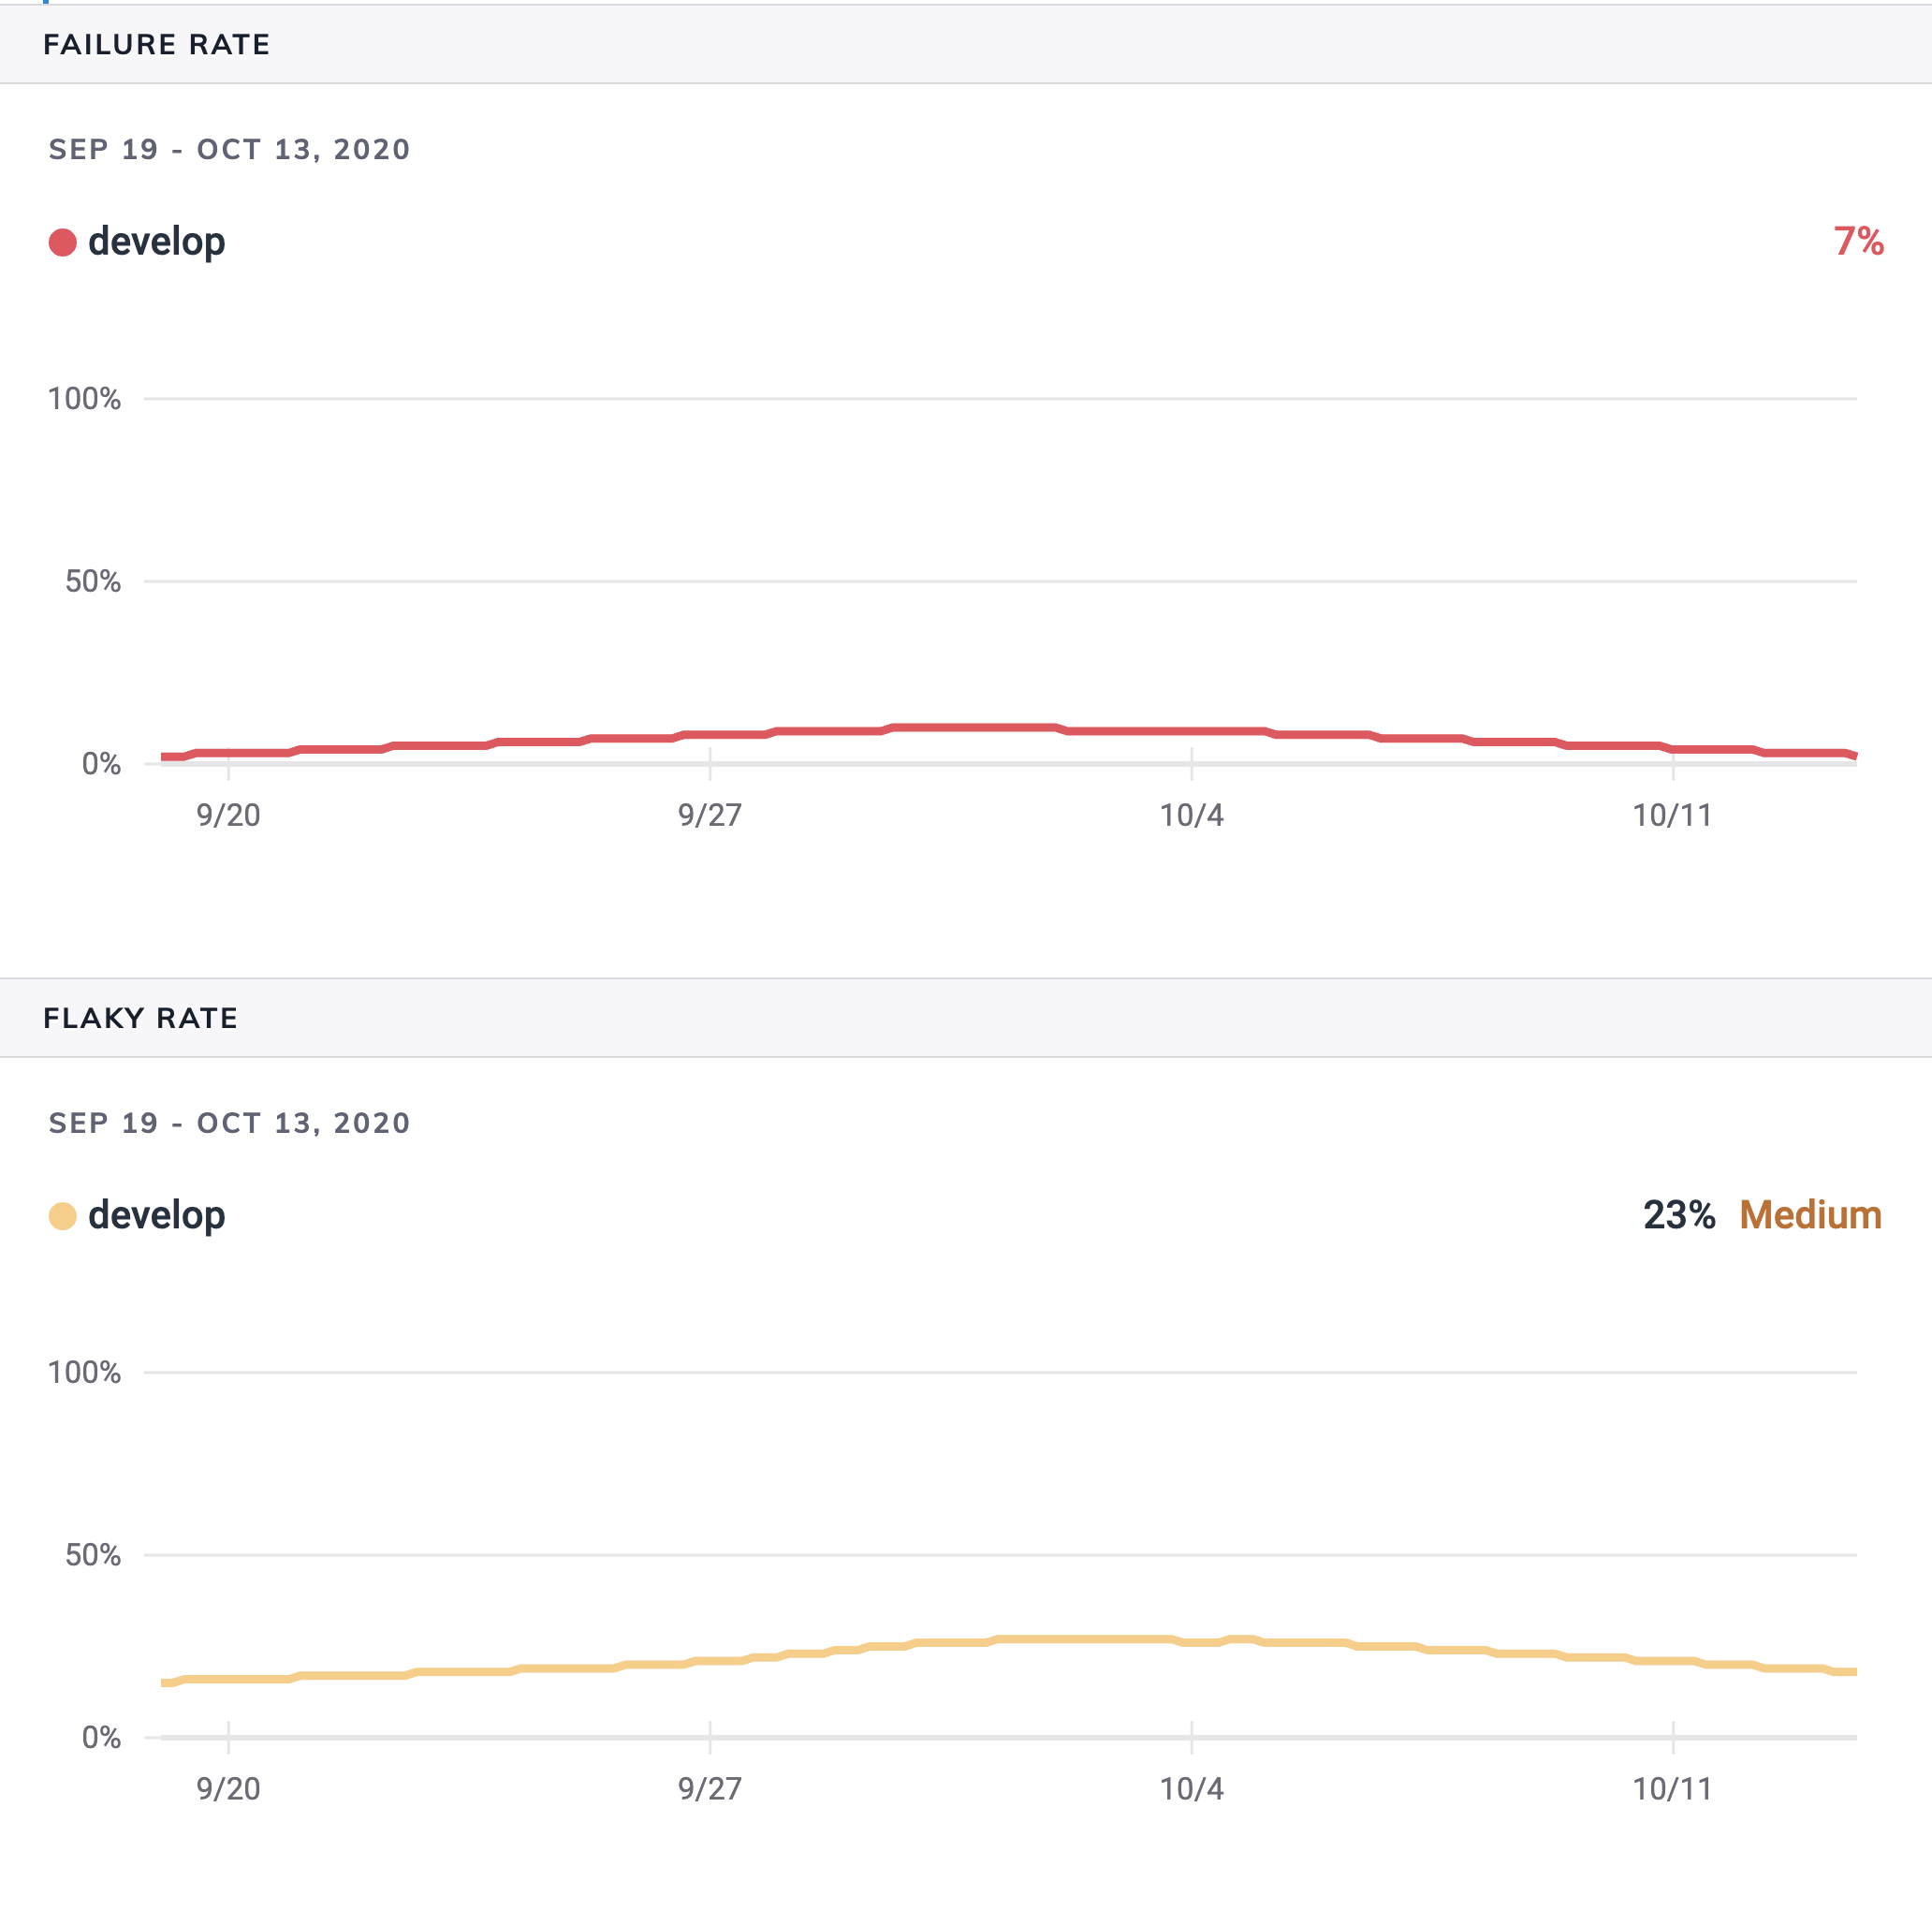
A test case flagged as flaky could have still passed after multiple test retry attempts. The test result status of individual test retry attempts is separate and distinct from the final test status.
For example, a project is configured to retry failing tests up to 3 times. The first two attempts fail, but the last and third attempt passes, resulting in a final status of passing.
With this concept in mind, it is possible to always have zero final failure rate while exhibiting flake as demonstrated below:
Flake Alerting
tip
Test flake alerting is available to users with a Team Dashboard plan.
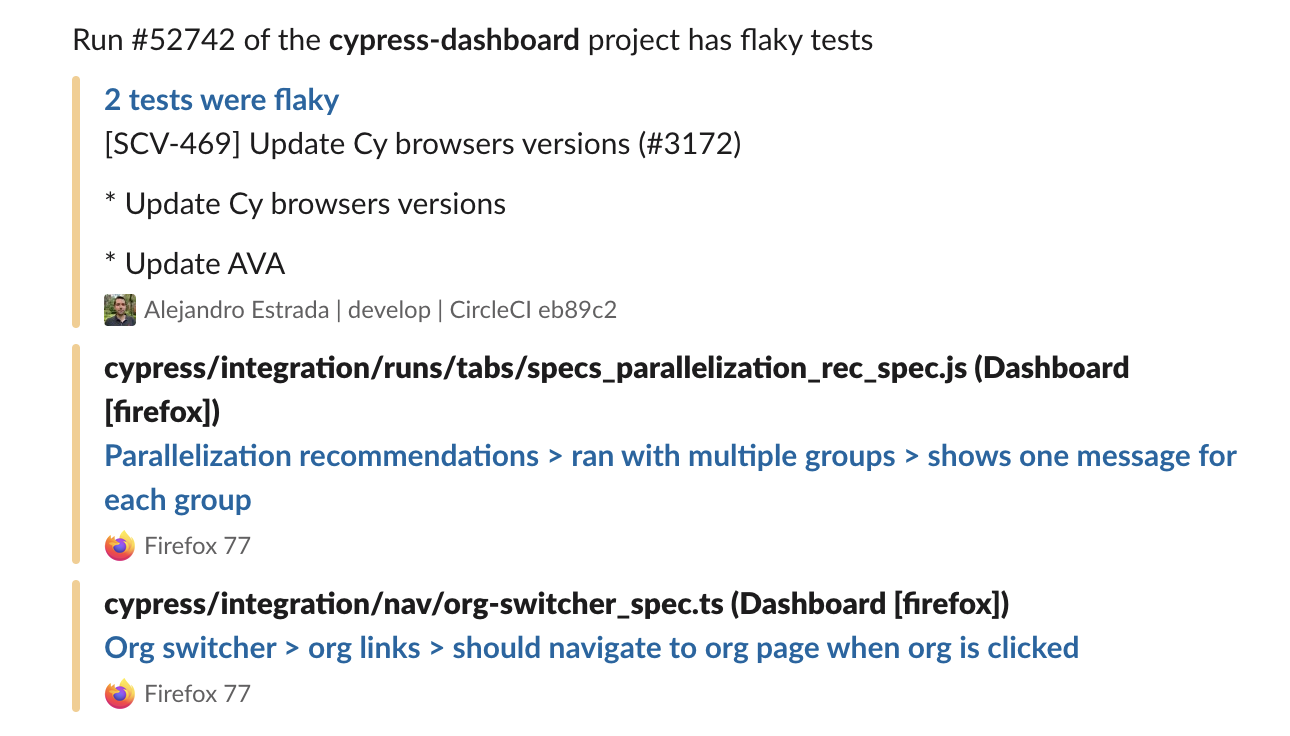
The Dashboard can provide alerts via GitHub and Slack integrations, to further assist with staying on top of flake occurrences.
GitHub
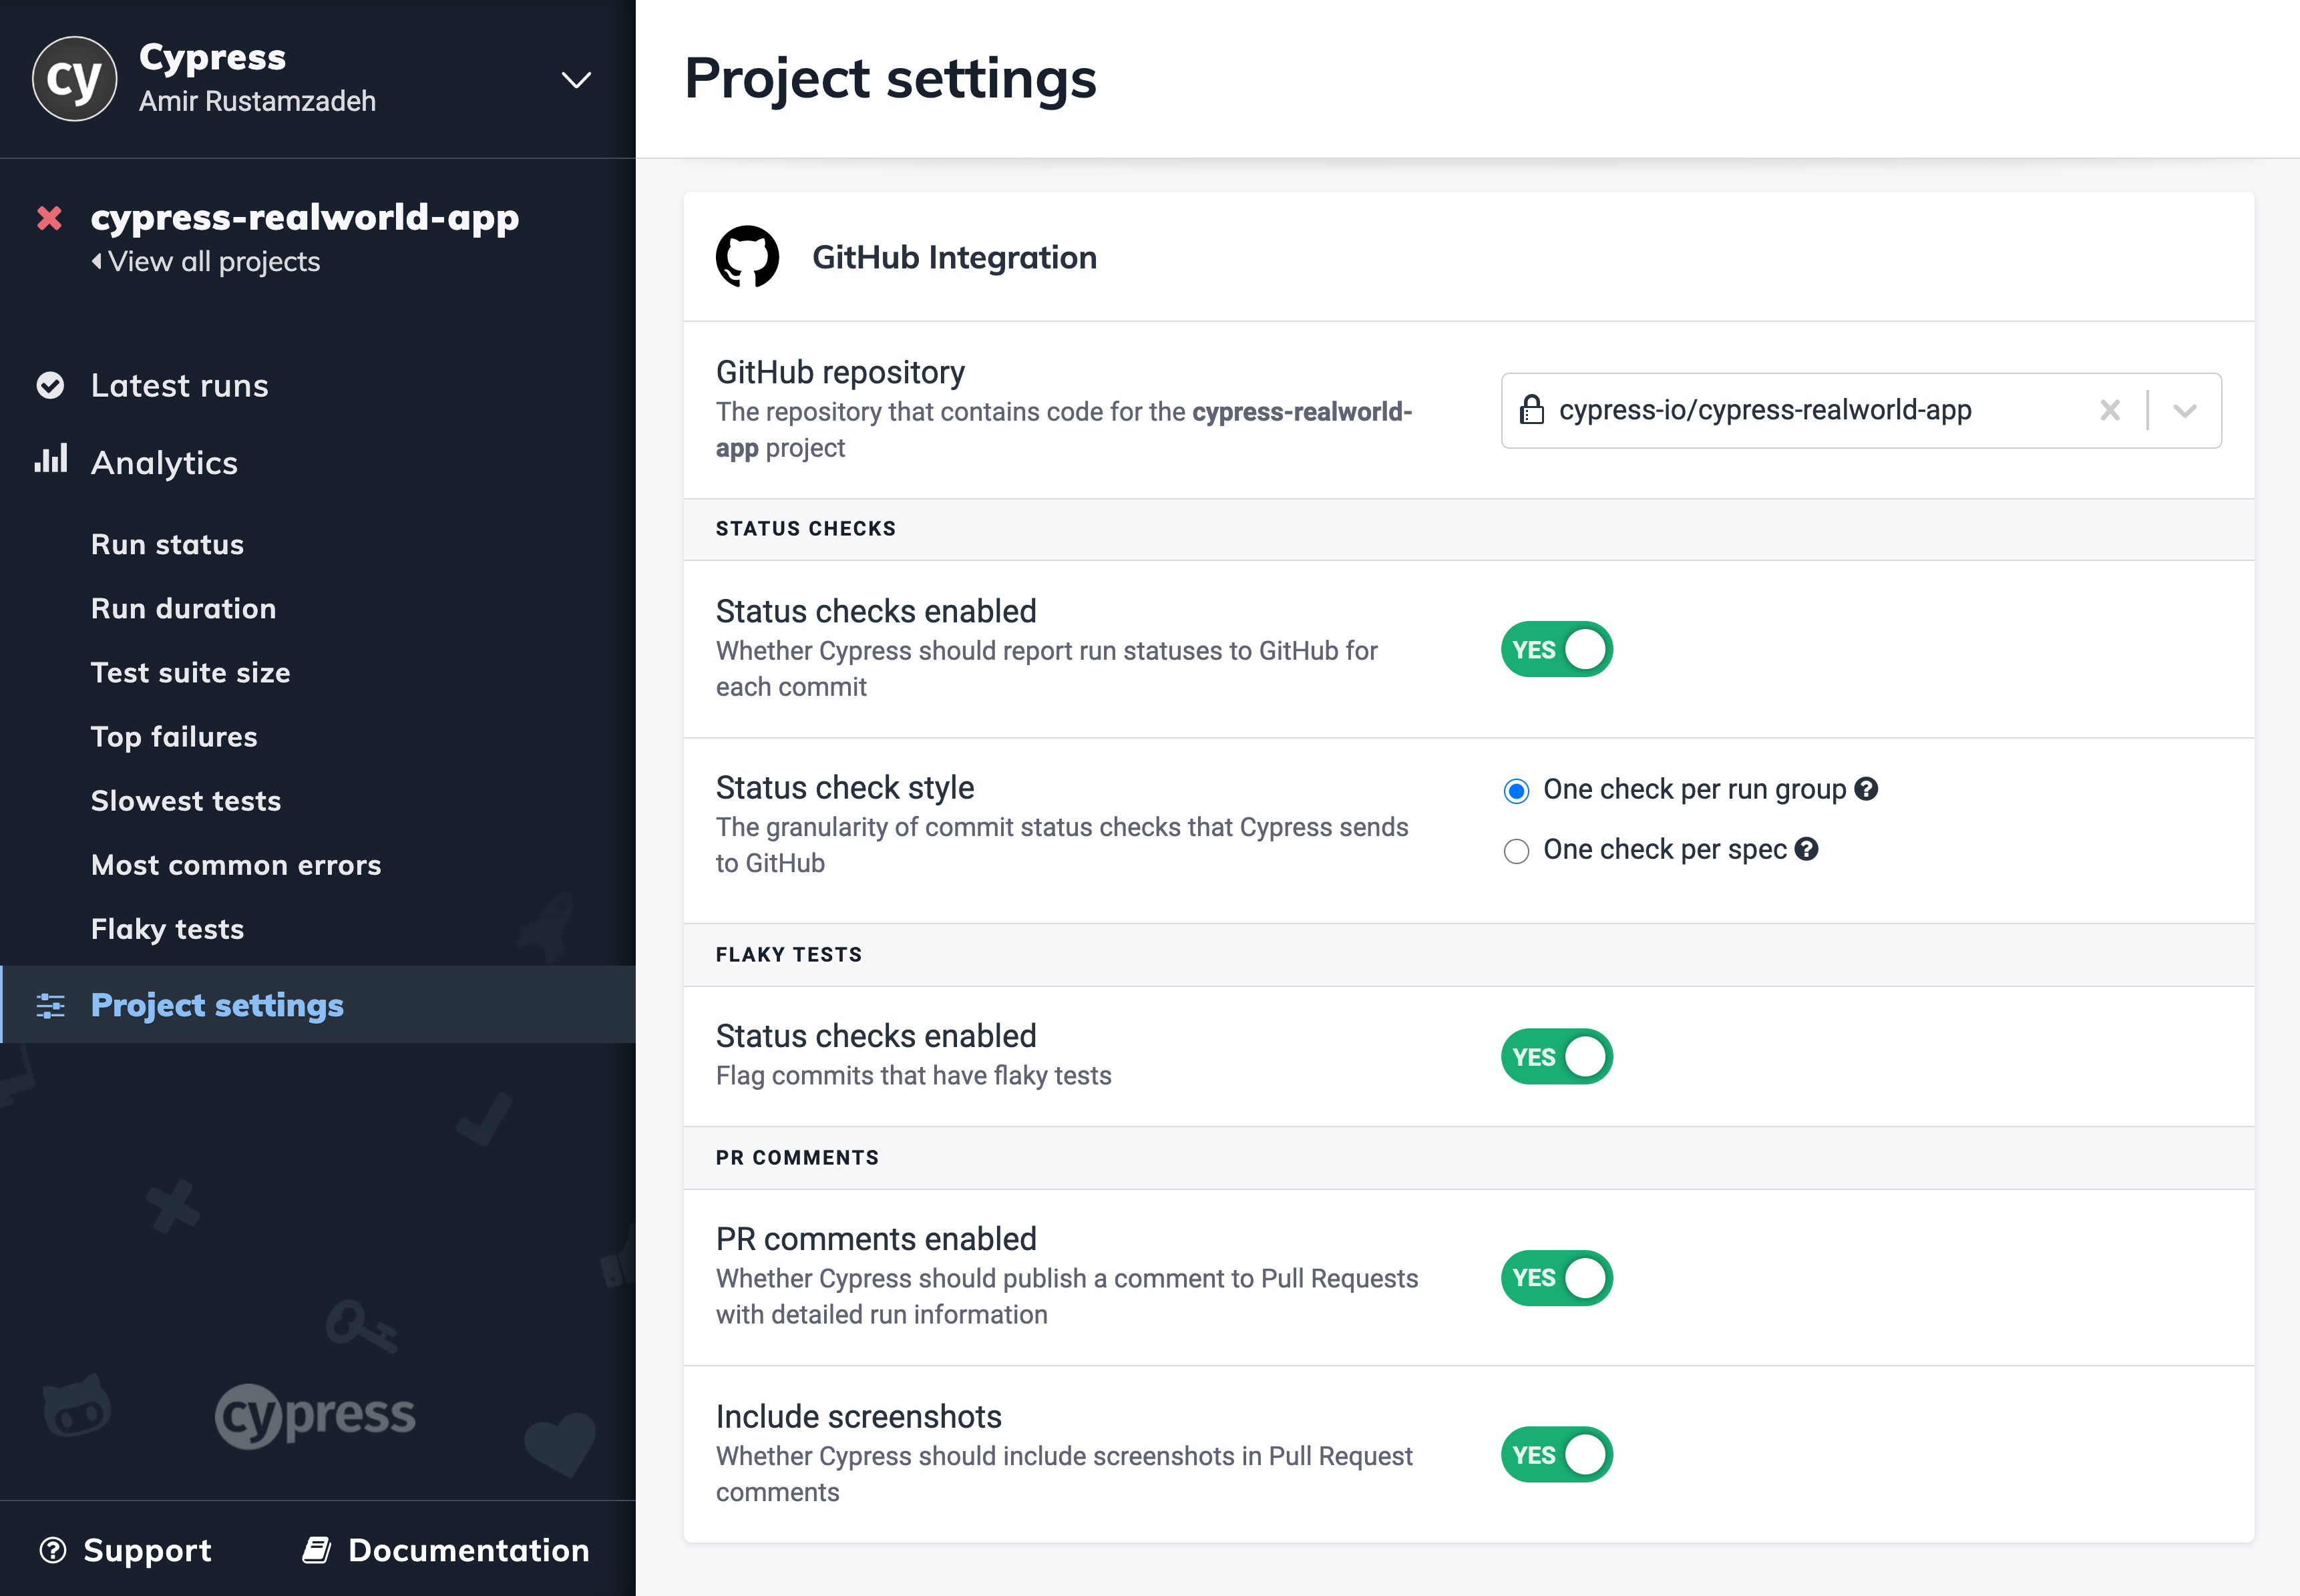
Flake alerting via GitHub PR comments and status checks can be enabled within a project's GitHub integration settings:
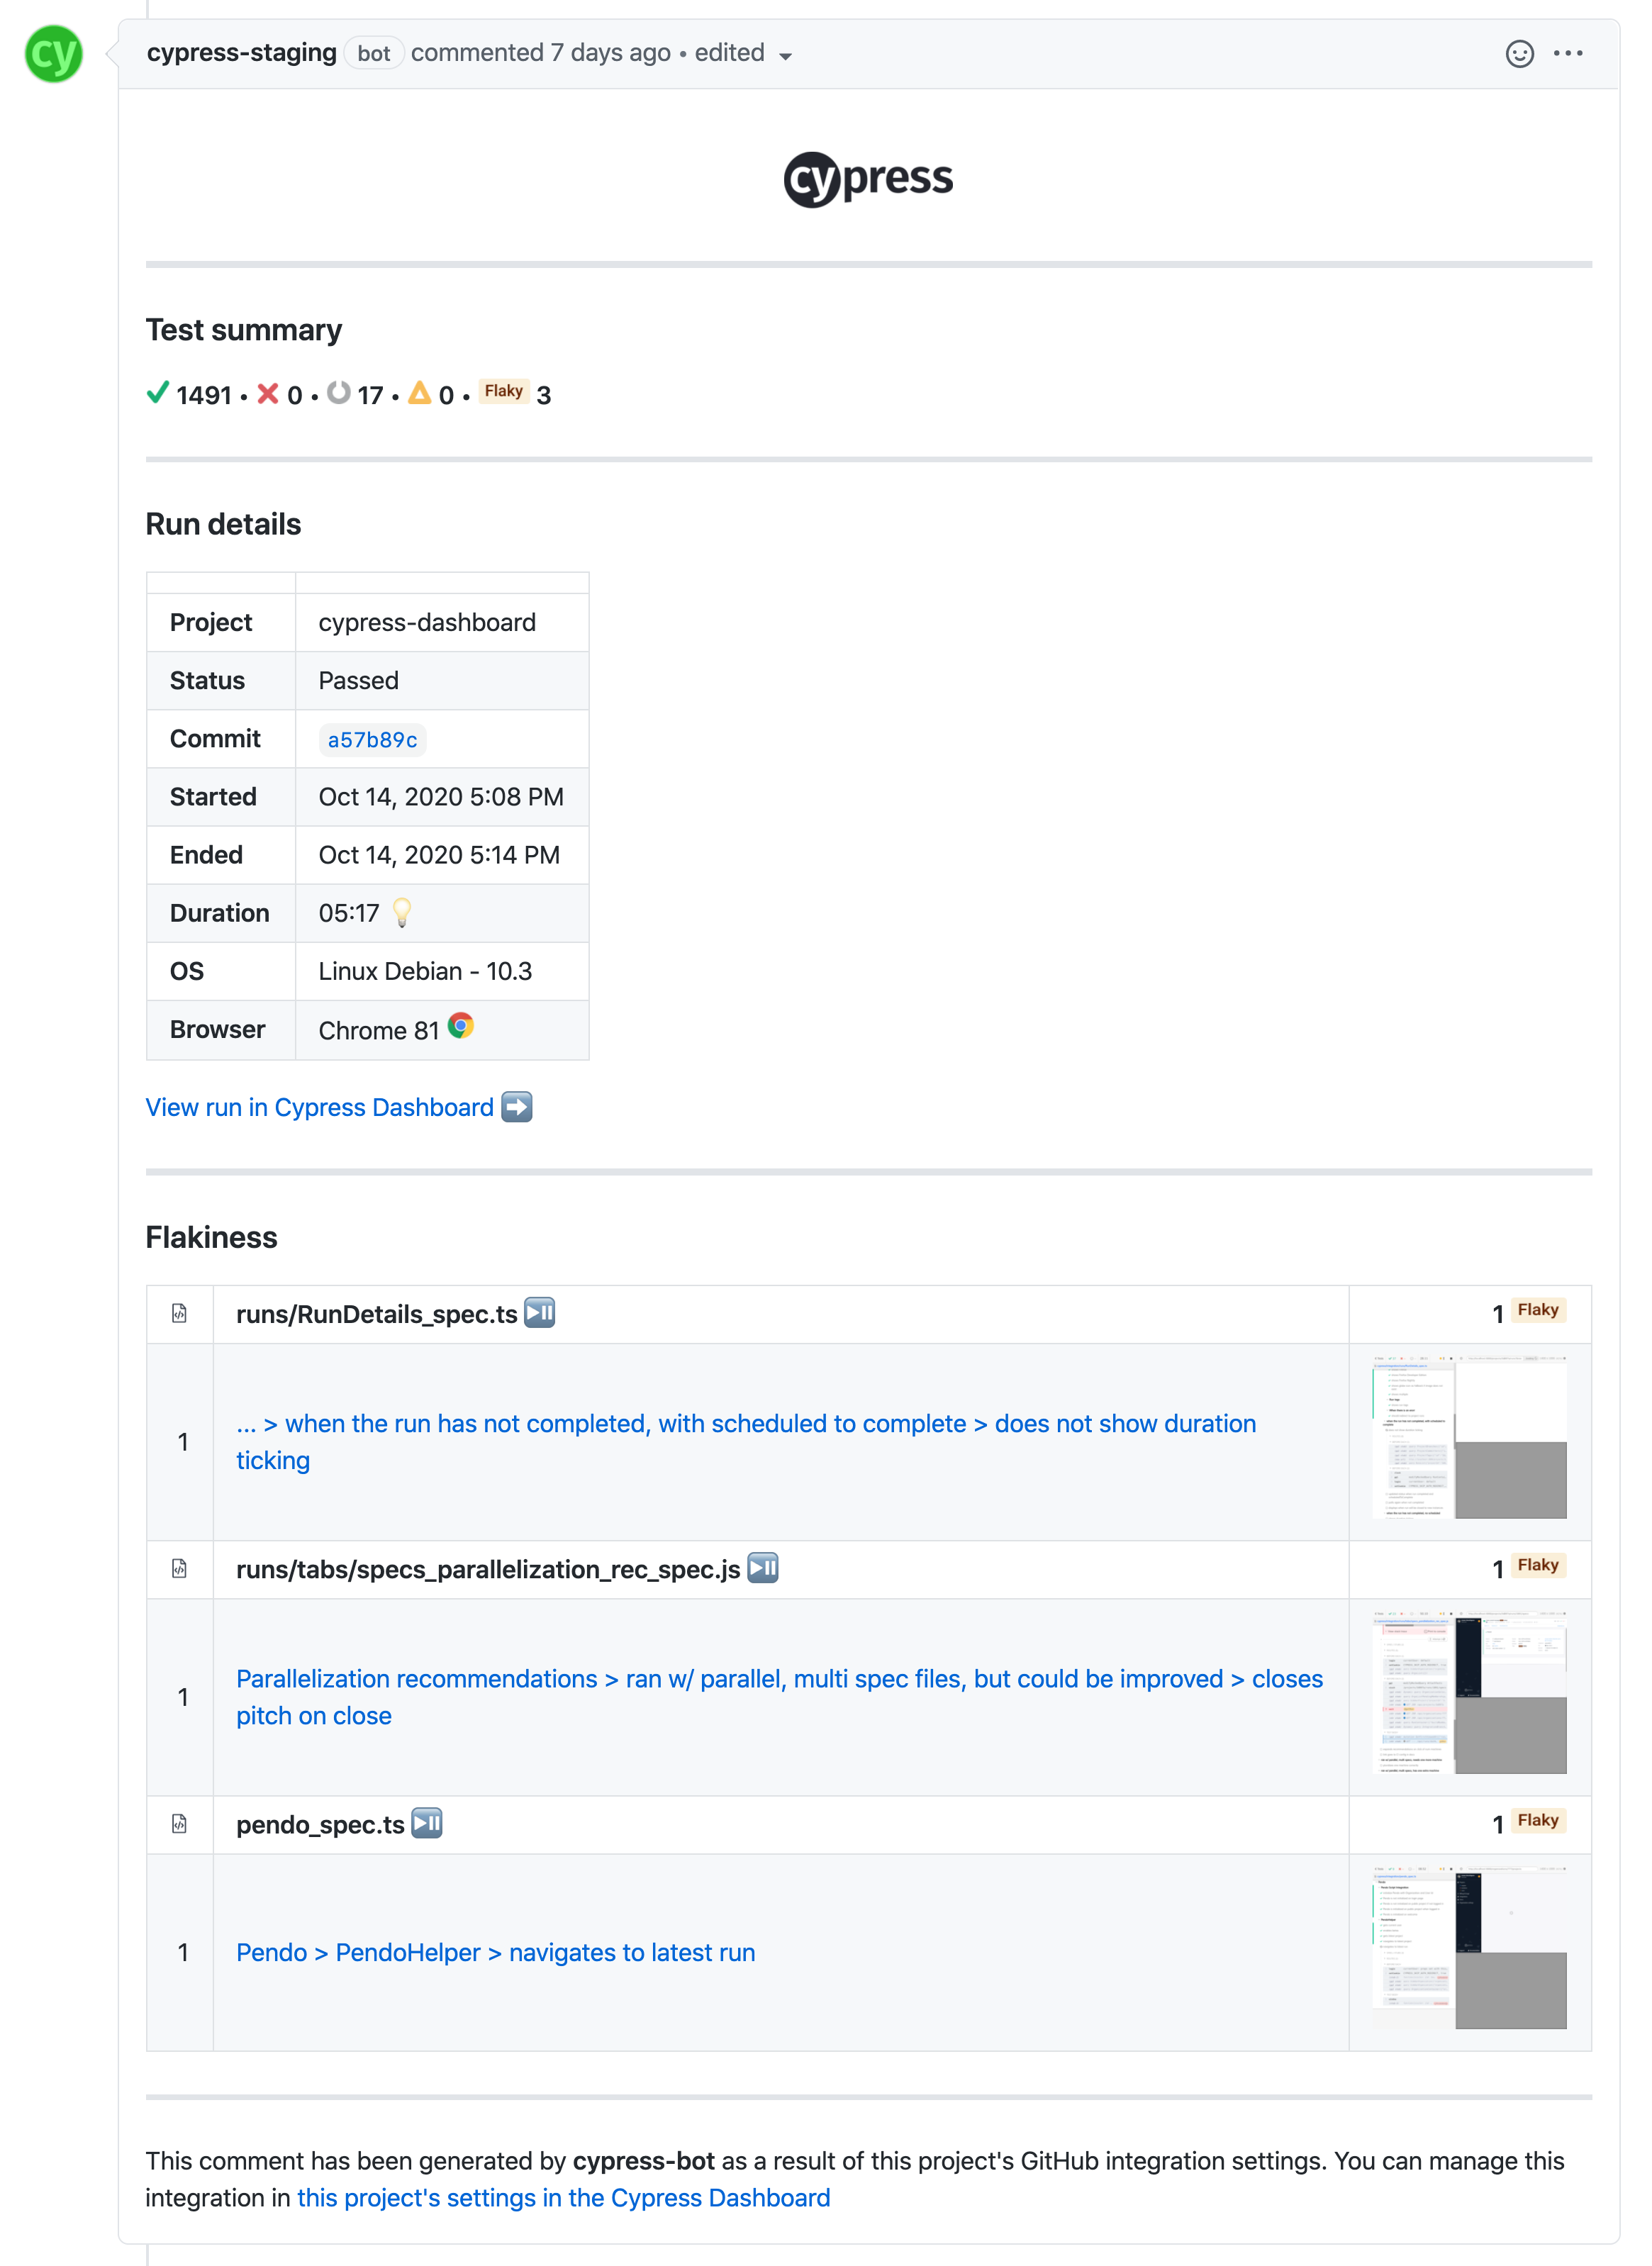
After enabling GitHub flake alerting, GitHub PR comments will show the number of flaky tests associated with the PR within the test summary, and include a "Flakiness" section highlighting the specific tests that flaked.
Slack
Flake alerting via Slack can be enabled within Slack integration settings:
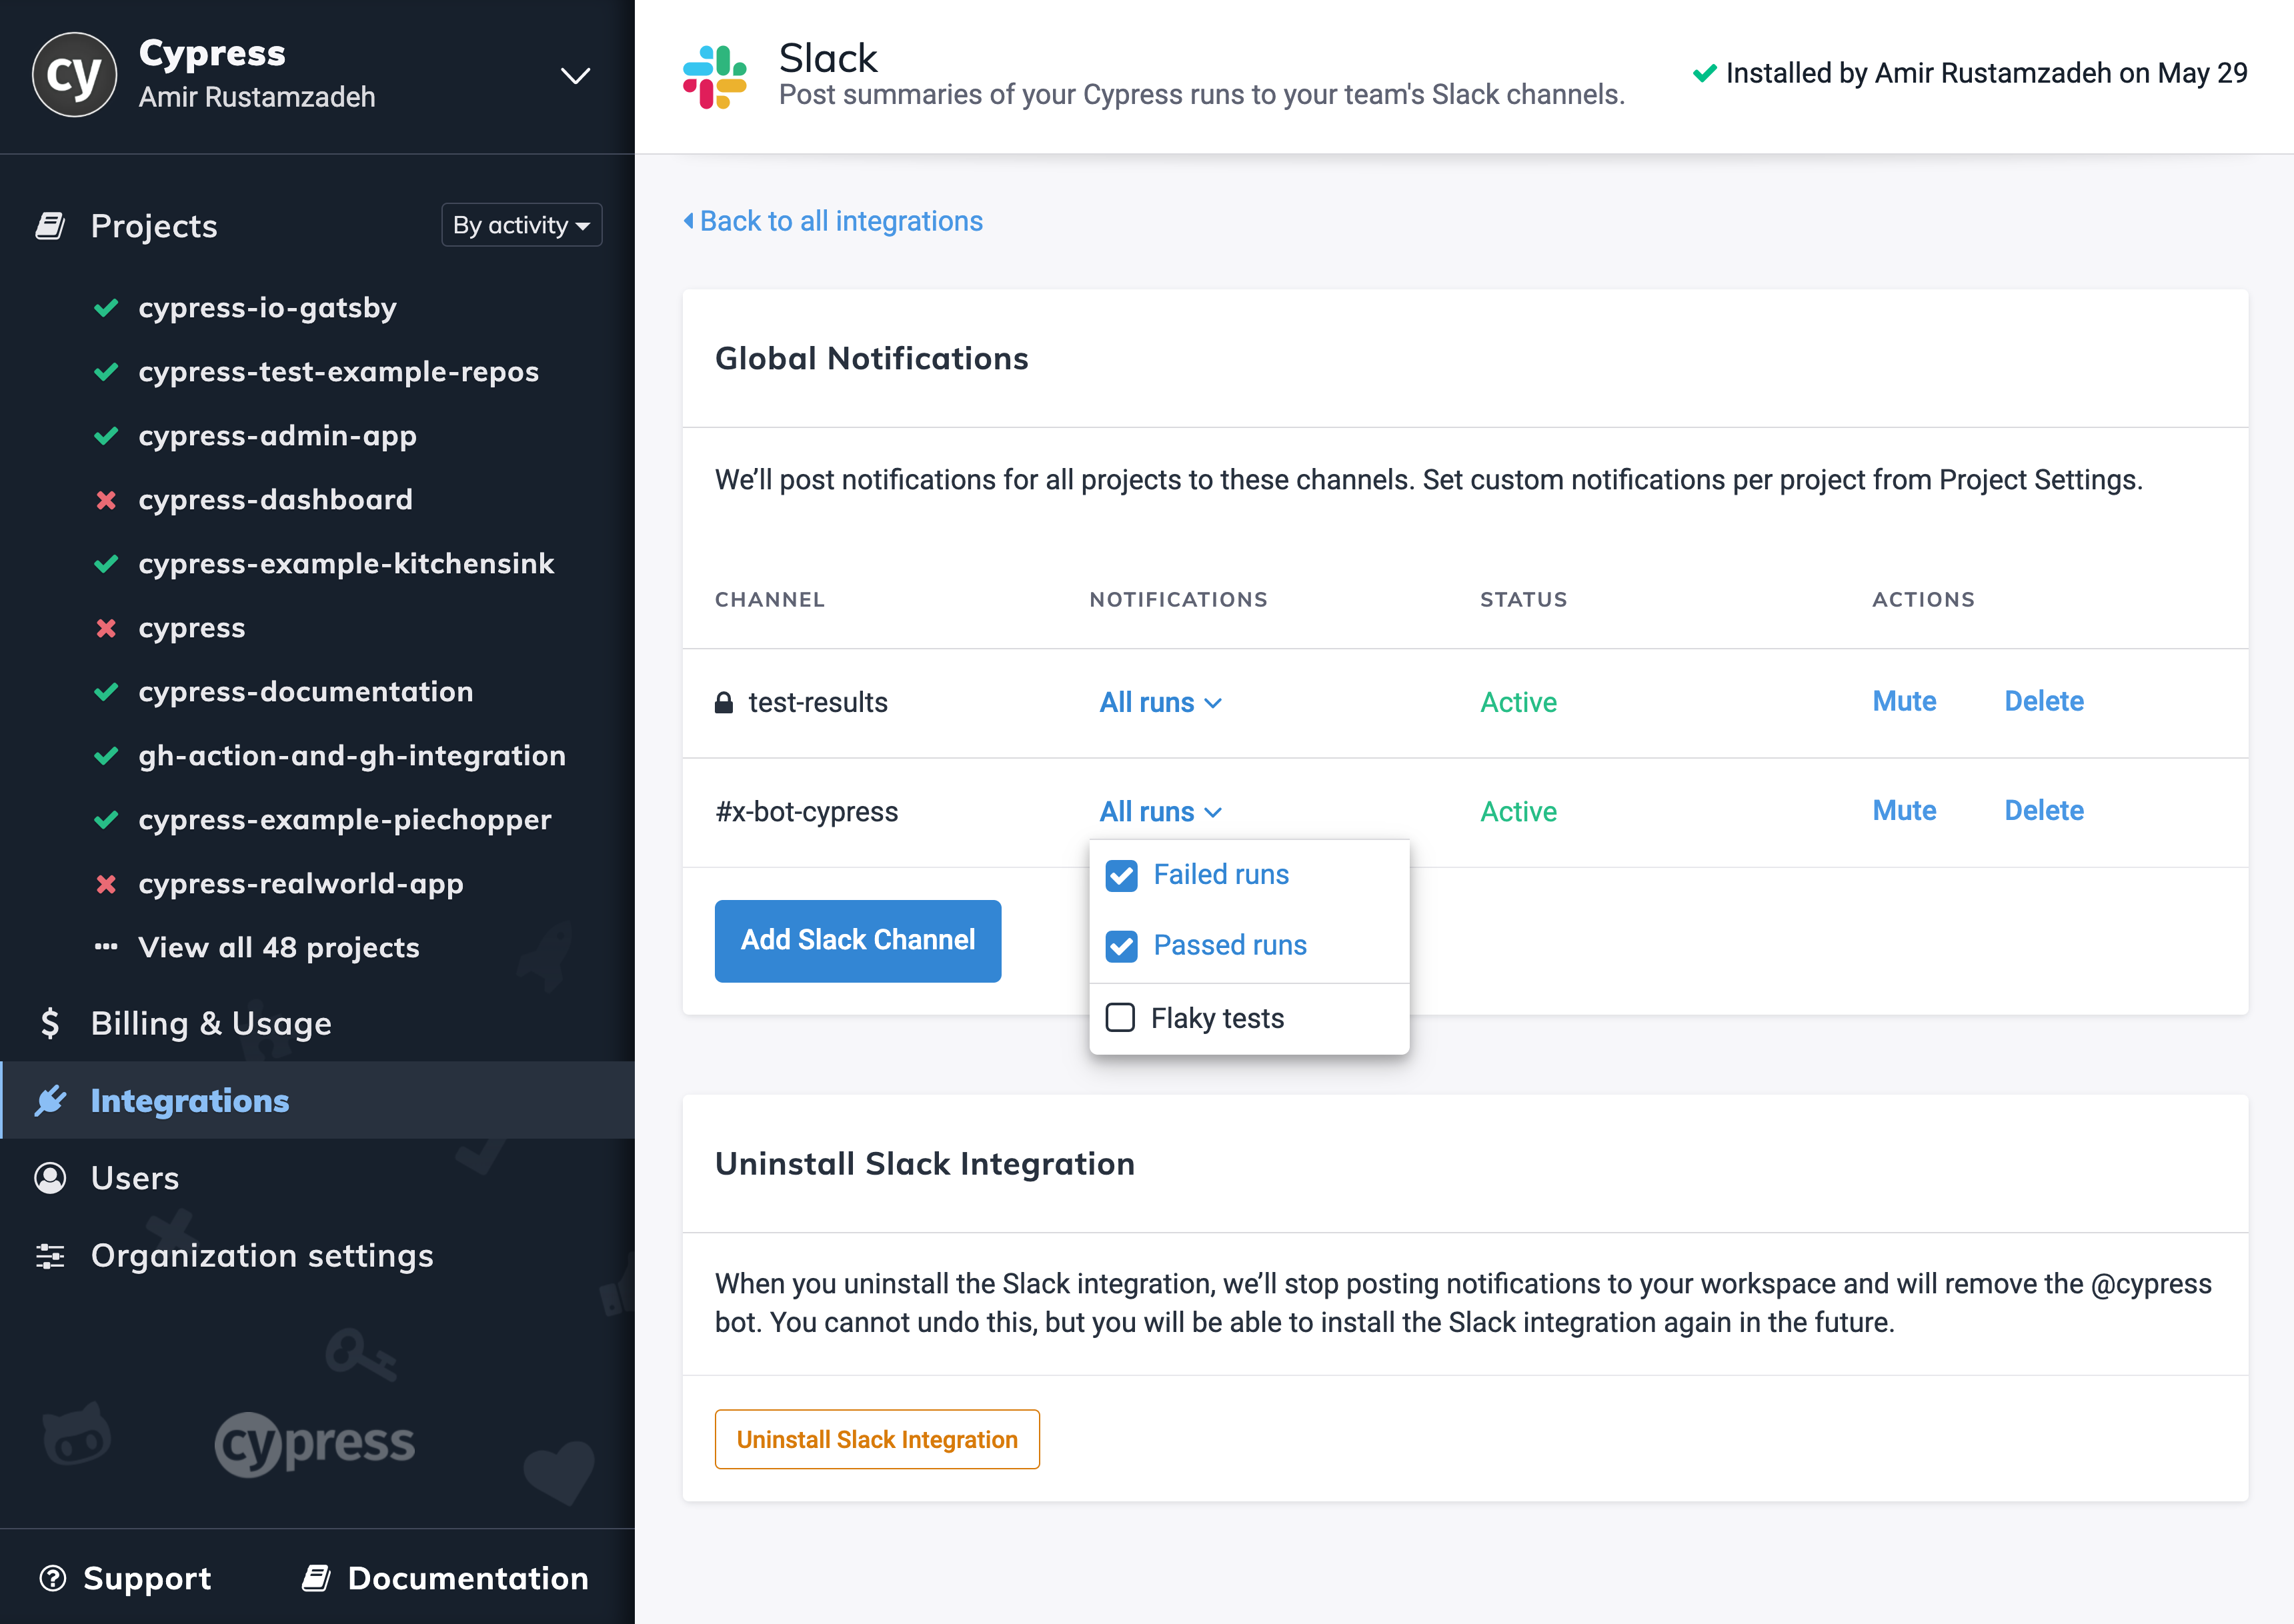
After enabling Slack alerts, the Dashboard will send Slack messages whenever flaky tests are detected:
See Also
- Read our blog posts about fighting the test flake.